Great Outcomes
Great job, first-choice grad placement, good salary; how do you define success? Look at how our grads stack up.
- Hanover post-graduation outcomes rank in the 98th percentile among colleges nation-wide
- 99% of Hanover graduates were employed or continuing their education within 7 months of graduation
- 92.6% were fully employed within 7 months of graduation having a full-time job for which a bachelor’s degree is the norm
- 99% of recent education students are employed or in graduate school within 6 months of graduation
- 100% of education students pass Core Licensure Exam


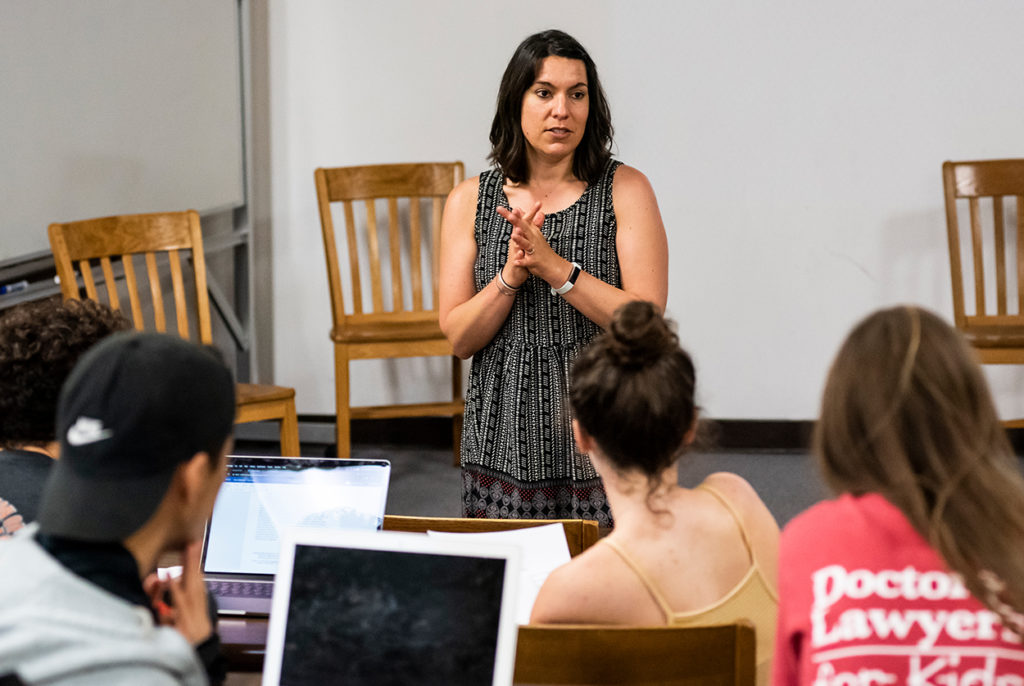
Talal Laguda ’26
Electrical Engineering major
Click to read profile ▼
Intern to Permanent Position as a Field Engineer
Following graduation, I will begin working as a Field Engineer for Turner Construction Co, the same company I interned for last summer. In this position, I will manage technical operations outside of a centralized office. This work looks like Inspecting equipment after it’s been installed, conducting site inspections, writing RFI’s for field teams who need direction on how to proceed with work, directing and coordinating on-site teams, providing technical support and training and being a liaison between owners and Trade Partners.
I found this opportunity through a campus career fair and was supported through the process by career peer mentors, professors, friends, and online research. What excites me most about this role is the opportunity to solve real-world problems every day and contribute to projects that have a meaningful impact on surrounding communities. During my time at Hanover College, I developed strong critical thinking and problem-solving skills that prepared me to succeed in rigorous environments. Balancing multiple jobs alongside my engineering coursework strengthened my time management, adaptability, and organizational abilities. I would like to thank Professor Brooks for encouraging me to stay in engineering when it got rough. That support played an important role in helping me reach this point.

Adam Combs ’24
Engineering major
Click to read profile ▼
Finding My First Destination Job
I’m working for Martinrea International as a Process Engineer. I found this position through Professor Brooks who had a connection and recommended me for this position.
In choosing the engineering field, my father, Benjamin Combs, played a huge role in my decision. I would also like to give shout-outs to both of my engineering professors for helping me through my entire college career. Professors Brooks and Professor Phillips were huge inspirations and brought passion into their teaching. They made everything super understandable and made classes more than just about grades. Honestly, I don’t think I would have made it through my engineering major if they were not my professors.
The engineering major at Hanover helped prepare me for this position. It taught me all the fundamental aspects of what an engineer is and then delved deeper into specific subjects such as thermodynamics and fluid mechanics. Additionally, with Hanover’s focus on liberal arts, I developed more soft skills that engineering students at other universities may not have, such as effectively communicating, and being more well-rounded. And, through Hanover, I gained two years of internship experience during my college career, which helped me secure a very high starting salary and allowed me to stand out above the competition.
My advice to those searching for their first job is to never let yourself feel defeated. I had been applying for jobs for months and faced rejection after rejection, or employers did not want to wait until my graduation date. Eventually, after continuously applying to jobs, I finally had multiple offers and opportunities to choose from. It may seem like no one wants you at first, but if you keep trying, you will find a multitude of companies wanting your skills and mindset.

Megan Schuler ’26
Biology and Chemistry double major
Click to read profile ▼
A Future in Discovery: Pursuing Cancer Research at IU School of Medicine
I will be pursuing a Ph.D. in Biomedical Sciences at the Indiana University School of Medicine. As a future doctoral student, I aim to investigate the mechanisms that drive cancer in order to improve treatment options and make a meaningful impact on patient care, particularly through work at the IU Simon Comprehensive Cancer Center. I discovered this opportunity through a professor’s recommendation and was supported throughout my application process by my family, friends, and professors.
During my time at Hanover, I built a strong academic foundation through coursework in research methods, statistical analysis, and anatomy, which has prepared me for the challenges of advanced study. I’m especially excited about the opportunity to contribute to innovation in the biomedical field while helping patients better understand their health and improve their quality of life. My long-term goal of working behind the scenes in healthcare aligns closely with a research-focused career.
I credit my time at Hanover, including my classes, labs, and mentorship experiences, for shaping me into a capable and confident scientist. I encourage other student to connect with professors and explore research opportunities, such as summer programs like the SUREBS program at IU School of Medicine, which helped solidify my own path. I’m grateful to the Biology and Chemistry departments and to Dr. Mynhardt, whose mentorship played a pivotal role in my journey.

Samantha Bowling ’26
Kinesiology & Integrative Physiology major
Click to read profile ▼
On the Road to my Dream Career
I will be pursuing a Doctor of Physical Therapy degree at Hanover College. I’m excited to continue my education, to stay in my Hanover College built community, and to be able to start my dream career in a couple of short years. This aligns with my long term goals by being able to further my education in a career path that I know will be a benefit to society.
My undergraduate degree at Hanover prepared me for this opportunity. All of my undergraduate courses were directly applicable to the graduate program. Furthermore, the presentations I performed, the close-knit communication with faculty, and the meaningful lab experiences provided me with an excellent background for further education in DPT school. The experiences that had the biggest impact on me were Research Methods, the KIP senior seminar course, and anatomy and physiology with lab. These were hands on experiences that took me out of my comfort zone and helped me to excel in my communication, my vocabulary and knowledge, and my ability to withstand difficult situations.
I would like to thank the following professors and staff who contributed to my success, Dr. Molly Winke, Olivia Owens, Dr. Steven Newman, Coach T (Tereshko), and Sarah Fantin.
Graduate on Time
- Hanover’s four-year guarantee ensures timely graduation, or your fifth year is tuition free
- 96% of our graduates finish in four years or less without summer school
Many of our graduates continue on to doctoral level degrees and were awarded national competitive scholarships, such as: Fulbright, Gilman, Leadership Alliance, Amgen, DAAD-RISE, the JET Programme, the Peace Corps and National Science Foundation funded Research Experiences for Undergraduates.
Quality of Experience

Hanover seniors reported better experiences on average than seniors at other baccalaureate institutions in the following areas:
- Student Faculty Interaction
- Quality of Interactions
- Supportive Environment
- 59% of students over the past 5 years had an off-campus experience
*Based on the 2023 National Survey of Student Engagement


An alumni survey of graduates 10 years out also reported:
- Good Teaching & High-Quality Interactions with Faculty: 4.4 / 5
- Challenging Assignments & High Faculty Expectations: 4 / 5
- Growth on Intellectual Outcomes: 4 / 5
- Satisfaction with Institution: 4.7 / 5
Based on effect sizes, all of these averages show a large positive difference compared to the other institutions who participated in the survey.
Source: 2022 Higher Education Data Sharing Consortium (HEDS) Alumni Survey (alumni who graduated from Hanover 10 years ago)
| Career Outcomes | Full-time Employment | Part-Time Employment | Employment | Continuing Education | Seeking Career Options | |
|---|---|---|---|---|---|---|
| Hanover College | 99.5% | 67.4% | 2.8% | 70.2% | 21.9% | 0.5% |
| Great Lakes Schools | 89.7% | 61.7% | 4.8% | 66.5% | 20.6% | 10.2% |
| Baccalaureate A&S Schools | 91.3% | 62.3% | 5.8% | 68.1% | 18.9% | 8.4% |
| Private Schools | 91.9% | 63.8% | 4.9% | 68.7% | 19.9% | 8.0% |
| Public Schools | 81.5% | 55.1% | 4.9% | 59.9% | 19.1% | 18.2% |
| Very Small Schools | 91.4% | 64.7% | 7.2% | 72.0% | 16.7% | 8.5% |
| All Schools Participating | 85.7% | 58.7% | 4.8% | 63.5% | 19.2% | 14.1% |